History from Below
Poverty
Instructions:
The non-elite can speak to us in many 'voices': letters, lyrics, images, court records ... the list of possible sources is endless. When examining sources don't settle for the obvious, look for context, allegory (a story, poem, or picture that can be interpreted to reveal a hidden meaning), and remember that the absence of something can also be important.
Using your source analysis skills examine each of these sources.
Feel free to use your devices to further research the documents.
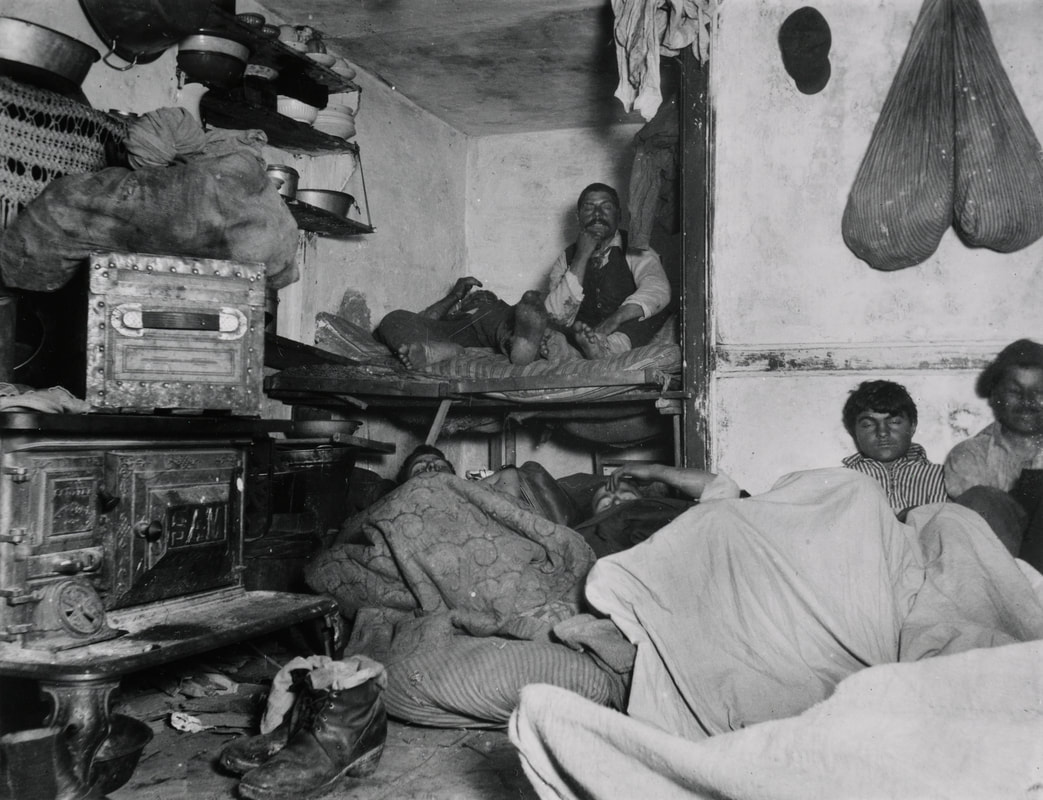
Document 1 - Lodgers in Bayard Street - 1888
Photo by Jacob Riis from How the Other Half Lives
Photo by Jacob Riis from How the Other Half Lives
Document 2 - Woody Guthrie - Jesus Christ - 1940.
Document 3 - Spearhead- Crime to be Broke in America - 1994
Document 4 - The Economist - Poverty in America - March 1, 2018
IT IS often said that efforts to fight poverty have failed. Surveys suggest only 5% of Americans think that anti-poverty programmes have had a big impact; 47% say they have had no impact or a negative one. And most people think that poverty is spreading—a view expressed by many politicians. In 2014, the current House Speaker, Paul Ryan, then chairman of the House Budget Committee, issued a scathing critique of welfare programmes arguing they “are not only failing to address the problem. They are also in some significant respects making it worse.”
Mr Ryan based that conclusion on data that may also inform popular scepticism about poverty programmes. In 2014 the US Census Bureau reported that the federal poverty rate was 15%, a drop of only 2.5 percentage points since Lyndon Johnson declared the war on poverty 50 years ago. But the method for calculating the official poverty rate is almost perfectly designed to obscure the effect of government programmes on the quality of life of poor people. And that is a shame, because better measures suggest welfare has lifted millions out of poverty.
The Census Bureau’s poverty line is set as a fixed level of pre-tax cash income adjusted by family size and composition and, over time, for urban consumer price inflation (CPI-U). That it is a pre-tax measure means the poverty calculation ignores the impact of tax credits and in-kind transfers like housing and nutrition assistance. And using the CPI-U overstates the inflation in the price of goods purchased by poor people.
Correcting for tax and inflation problems alone make a difference, according to Bruce Meyer and Jason Sullivan, economists. The official poverty rate climbed between 1972 and 2015 from 11.9% to 13.5% of the population. But after-tax income poverty using a better measure of price change fell from 15.6% to 7.3% over the same period. And a measure they design that uses consumption rather than income to define poverty suggests a decline from 16.4% to 3.0% since 1972.
These measures better reflect changes in household welfare. Bruce Sacerdote, an economist at Dartmouth College notes the poorest quarter of households in America had 0.75 vehicles per household in 1970 compared to 1.4 per household in 2015. In 1960, more than one third of households in the bottom quarter of the income distribution lacked indoor plumbing; by 2015 virtually all households had indoor water and sewer systems. Microwave ovens have spread from luxury to ubiquity alongside mobile phones—microwaves are now owned by 97% of households.
And the improved situation of the poorest Americans is in part due to the war on poverty. Mssrs Meyer and Sullivan, who produce their estimates for the American Enterprise Institute, a conservative think-tank, suggest the sharp reduction in poverty is largely due to tax reform and credits, the expansion of anti-poverty programmes, social security benefits and more widespread education.
Christopher Wimer and his colleagues at Columbia University, meanwhile, have made an estimate of the total impact of government programmes, from tax credits to temporary assistance, housing programmes to government pensions, on their own (post-transfer) poverty measure. Before taxes and transfers, they estimate poverty would have increased slightly between 1968 and 2012, from 27% to 29% of the population. After taxes and transfers, the rate fell over that period from 26% to 16%. That suggests an increasingly important role for government programmes in decreasing poverty over time. They note that their analysis leaves out government health insurance programmes, which have also expanded greatly over time. They argue “government policies, not market incomes, are driving the decline” observed in poverty.
Inequality has grown considerably over the past two decades, and the role of the government in arresting that trend has been limited compared in to other rich countries. Donald Trump's tax changes are likely to widen the gap between rich and poor further. But for all its faults, the welfare system is helping—it appears to be the chief reason there has been a rise in the consumption of America’s poorest people over the last few decades. Over the same period the market has failed to deliver any income gain for those same people. The urgent need for reform is not of the welfare system, but the regulations and policies that produce such skewed market outcomes.

